Visualizing RuuviTag sensor data in Grafana Cloud
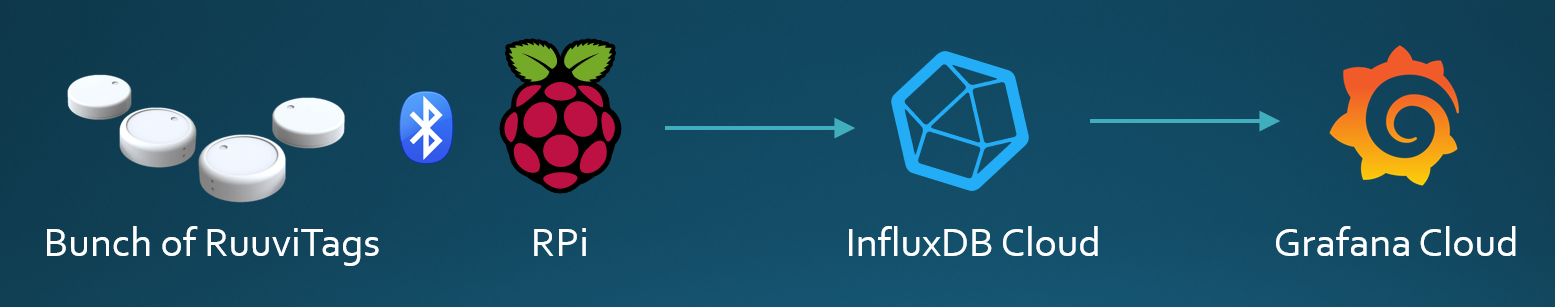
In this blog post, I’m demonstrating how to send RuuviTag sensor data to InfluxDB Cloud and visualize it in Grafana Cloud. The solution is really simple. I have few RuuviTag sensors around the house plus one outside. I have a Raspberry Pi W Zero that can communicate with the RuuviTags using Bluetooth. Measurement data is sent to InfluxDB Cloud using a simple python script. Finally I’m using Grafana Cloud for visualization. And yes, I know there is a RuuviTag Gateway for remotely monitoring the sensors, but where’s the fun in using ready made solution?
Reading RuuviTag measurement data
In case you’re not familiar with RuuviTags, they are wireless sensors for measuring temperature, humidity, air pressure and motion, accessible over Bluetooth. People use them, not only for measuring room temperatures and humidity, but for various use cases like measuring the temperature of a refridgerator or a sauna, the humidity of a cigar humidors or a greenhouse.
ruuvitag-sensor is a Python package that can be used to communicate with RuuviTag sensors and to decode the measurement data. Installing the package to a virtual environment is easy peasy stuff.
$ python3 -m venv ruuvitags
$ source ruuvitags/bin/activate
$ pip3 install ruuvitag-sensor
We can read the data using the following python script.
#!/usr/bin/env python3
from ruuvitag_sensor.ruuvi import RuuviTagSensor, RunFlag

run_flag = RunFlag()

def handle_data(found_data):
    print(found_data)

# List of MACs of sensors which will execute callback function
macs = ['F3:9A:99:EA:C7:C2','CD:F4:31:CF:C3:9D','C3:83:AF:C5:29:9B','D1:7C:E9:9C:D4:4E']

RuuviTagSensor.get_data(handle_data, macs, run_flag)
The actual payload that gets printed out to console looks like the following.
('C3:83:AF:C5:29:9B', {'data_format': 5, 'humidity': 62.43, 'temperature': 19.75, 'pressure': 1019.83, 'acceleration': None, 'acceleration_x': 644, 'acceleration_y': 828, 'acceleration_z': 0, 'tx_power': 4, 'battery': 2820, 'movement_counter': 103, 'measurement_sequence_number': 63337, 'mac': 'c383afc5299b', 'rssi': -70})
Let’s see how to get measurement data up in to cloud.
InfluxDB Cloud
InfluxDB Cloud is purpose-built platform for collecting, storing, processing and visualizing time series data. Common time series data use cases include monitoring APIs and server performance metrics, and working with industrial sensor data.
Being able to work with InfluxDB we need to use a suitable client library. I’m using InfluxDB Python client library.
$ pip3 install influxdb-client
We also need a bucket, an organization and a token. Bucket is the named location where time series data is stored. I have created a bucket called ruuvi with a 30 day retention.
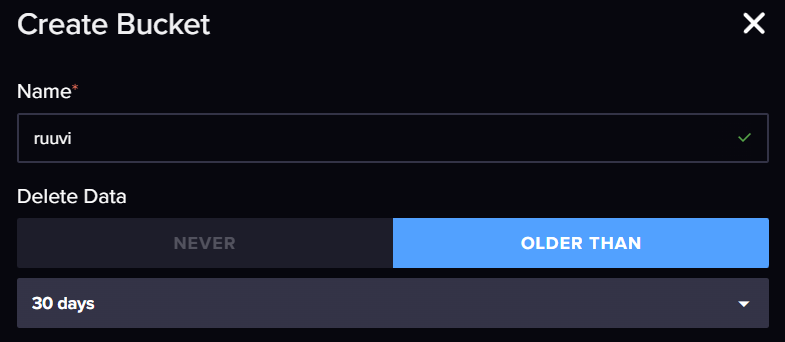
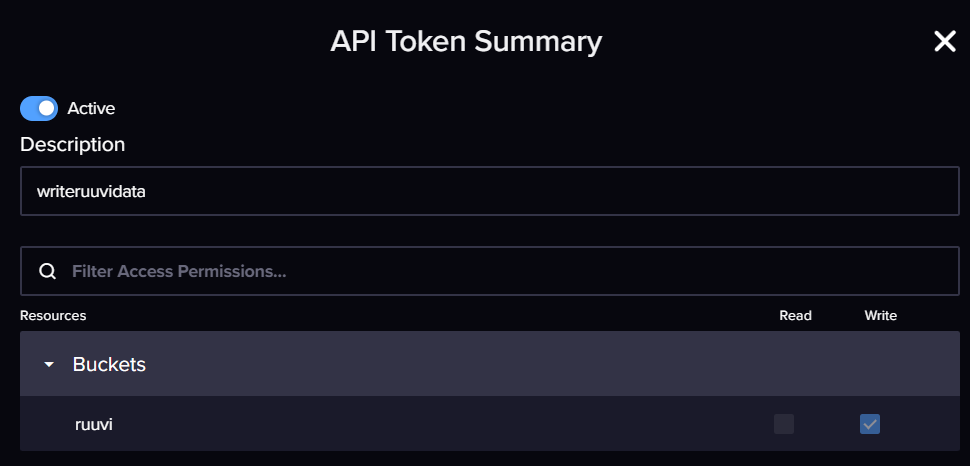
A bucket, just like everything else, belongs to an organization. Finally we need API token with permissions to write data to ruuvi-bucket.
We can send the measurement data into the InfluxDB Cloud using a small python script. Remember to fill in the missing variables. The host in my case is https://westeurope-1.azure.cloud2.influxdata.com as I’m using InfluxDB Cloud in Azure West Europe region. You can find all the different regions from the documentation. I have had some problems in the past with timeout while writing the measurement data, so I have configured retries.
#!/usr/bin/env python3
import influxdb_client
from ruuvitag_sensor.ruuvi import RuuviTagSensor, RunFlag
from influxdb_client import InfluxDBClient, Point, WritePrecision
from influxdb_client.client.write_api import SYNCHRONOUS
from urllib3 import Retry

# Fill in the variables
token = "<token-with-write-permissions-to-the-bucket>"
org = "<organization>"
host = "<host-url>"
bucket = "<name-of-the-bucket>"
retries = Retry(connect=10, read=10, redirect=5)

# Change here your own device's mac-address
macs = ['F3:9A:99:EA:C7:C2','CD:F4:31:CF:C3:9D','C3:83:AF:C5:29:9B','D1:7C:E9:9C:D4:4E']
timeout_in_sec = 5

run_flag = RunFlag()

def influxdb_client_init():
    # Create an InfluxDb client
    clientInfluxdb = influxdb_client.InfluxDBClient(host=host, token=token, org=org, retries=retries, timeout=60_000)
    return clientInfluxdb

def send_to_influxdb(found_data):
    try:
        mac = found_data[0]
        payload = found_data[1]

        point = (
            Point("ruuvi_measurements")
            .tag("mac", mac)
            .field("temperature", payload['temperature'])
            .field("humidity", payload['humidity'])
            .field("pressure", payload['pressure'])
            .field("accelerationX", payload['acceleration_x'])
            .field("accelerationY", payload['acceleration_y'])
            .field("accelerationZ", payload['acceleration_z'])
            .field("batteryVoltage", payload['battery'])
            .field("txPower", payload['tx_power'])
            .field("movementCounter", payload['movement_counter'])
            .field("measurementSequenceNumber", payload['measurement_sequence_number'])
        )
        write_api = clientInfluxdb.write_api(write_options=SYNCHRONOUS)
        write_api.write(bucket=bucket, org=org, record=point)
        write_api.close()
        print( "Sending message to InfluxDB Cloud: {}".format(point) )
    except Exception as e:
        print(e)
        write_api.close()

if __name__ == '__main__':
    print ( "Press Ctrl-C to exit" )
    print ( "Init" )
    clientInfluxdb = influxdb_client_init()
    RuuviTagSensor.get_data(send_to_influxdb, macs, run_flag)
Once the script is executed, measurement datapoints start beeing sent to InfluxDB as well as being printed on the console.
$ python3 write-ruuvi-data-to-influxdb.py
Press Ctrl-C to exit
Init
Sending message to InfluxDB Cloud: ruuvi_measurements,mac=C3:83:AF:C5:29:9B accelerationX=632i,accelerationY=848i,accelerationZ=12i,batteryVoltage=2700i,humidity=42.42,measurementSequenceNumber=36381i,movementCounter=146i,pressure=1008.59,temperature=5.92,txPower=4i
Sending message to InfluxDB Cloud: ruuvi_measurements,mac=D1:7C:E9:9C:D4:4E accelerationX=-260i,accelerationY=-976i,accelerationZ=44i,batteryVoltage=2721i,humidity=57.44,measurementSequenceNumber=15827i,movementCounter=67i,pressure=1008.34,temperature=18.84,txPower=4i
Sending message to InfluxDB Cloud: ruuvi_measurements,mac=F3:9A:99:EA:C7:C2 accelerationX=-960i,accelerationY=316i,accelerationZ=28i,batteryVoltage=2893i,humidity=91.03,measurementSequenceNumber=14278i,movementCounter=52i,pressure=1009.38,temperature=4.18,txPower=4i
...
While I could visualize measurement data from RuuviTags using InfluxDB Cloud’s Dashboards, this time around I’ll be using Grafana Cloud for visualization.
Grafana Cloud
In case you’re not familiar with Grafana Cloud. It’s an open and composable platform that enables observability without the overhead of building, installing, maintaining, and scaling the observability stack.
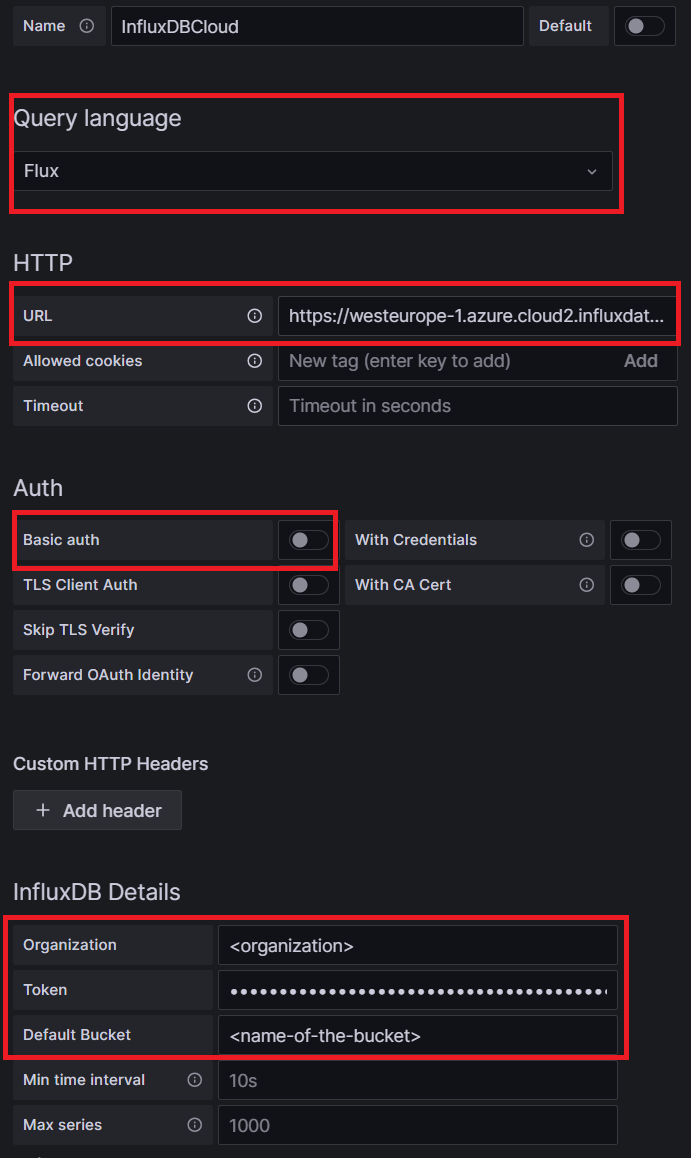
First thing to do is to add the InfluxDB Cloud instance as a data source (Home - Connections - Data sources - Add new data source - InfluxDB). Remember those InfluxDB-related variables for the script? Those are needed here too. First change the Query language to Flux and flip Basic Auth switch Off. URL equals “<host-url>”, Organization equals “<organization>”, Default bucket equals “<name-of-the-bucket>”. Token is also needed for the connection. This time I’m using a token with read permissions to the bucket. As a summary, these values needs configuring.
By clicking Save & test we should get an confirmation message stating that the datasource is working. 1 buckets found.
Then it’s time to start adding visualization.
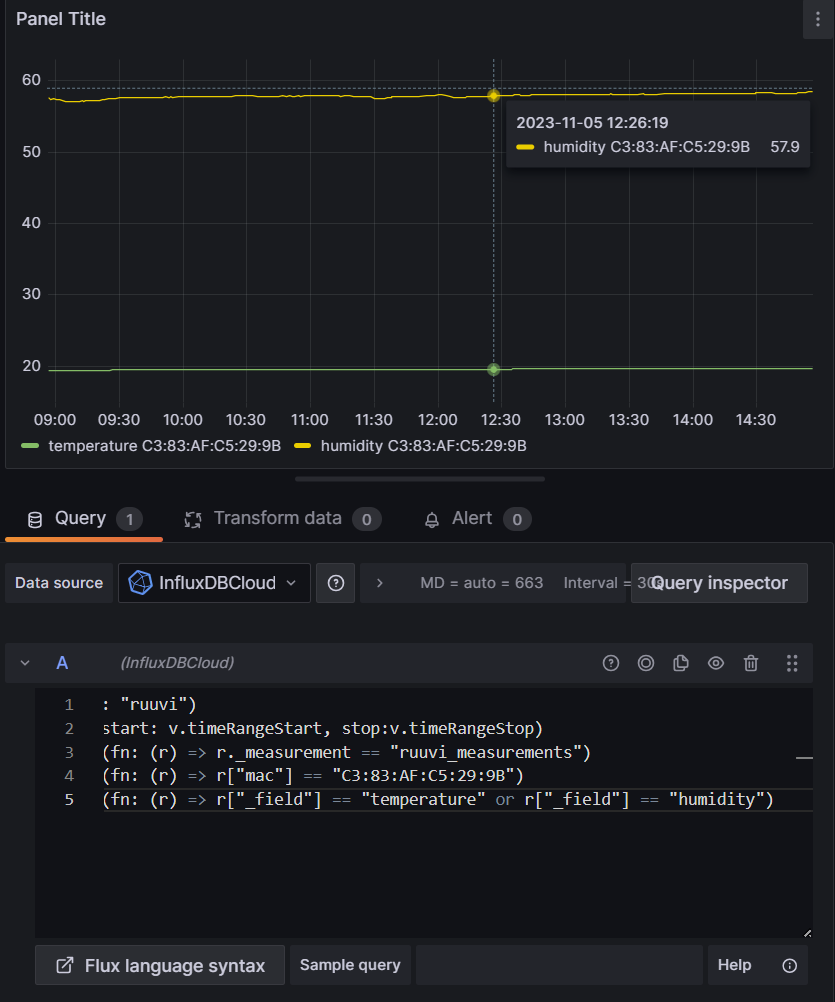
We can quickly test that we can read the data of a single RuuviTag (which has a mac address of “C3:83:AF:C5:29:9B”), by using a simple query such as.
from(bucket: "ruuvi")
  |> range(start: v.timeRangeStart, stop:v.timeRangeStop)
  |> filter(fn: (r) => r._measurement == "ruuvi_measurements")
  |> filter(fn: (r) => r["mac"] == "C3:83:AF:C5:29:9B")
  |> filter(fn: (r) => r["_field"] == "temperature" or r["_field"] == "humidity")
The panel changes to a line visualization with temperature and humidity of the chosen RuuviTag sensor.
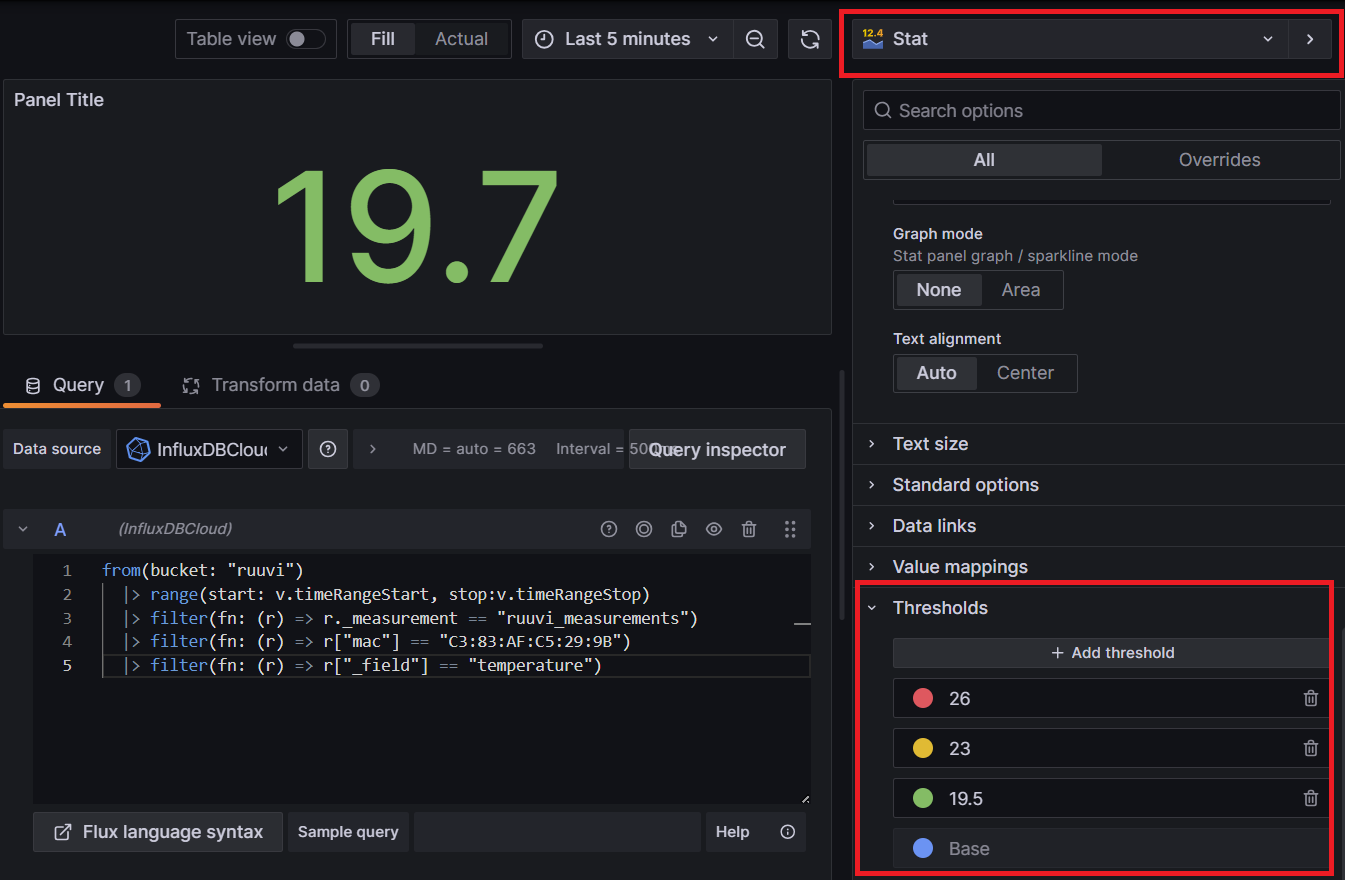
Lets take another example. This time I’ll only query the values of temperature data of the same RuuviTag.
from(bucket: "ruuvi")
  |> range(start: v.timeRangeStart, stop:v.timeRangeStop)
  |> filter(fn: (r) => r._measurement == "ruuvi_measurements")
  |> filter(fn: (r) => r["mac"] == "C3:83:AF:C5:29:9B")
  |> filter(fn: (r) => r["_field"] == "temperature")
There are tons of options for visulizing the measurement data. For example we can show the latest temperature measurement data point, and we can set up thresholds to change the colour of the shown value.
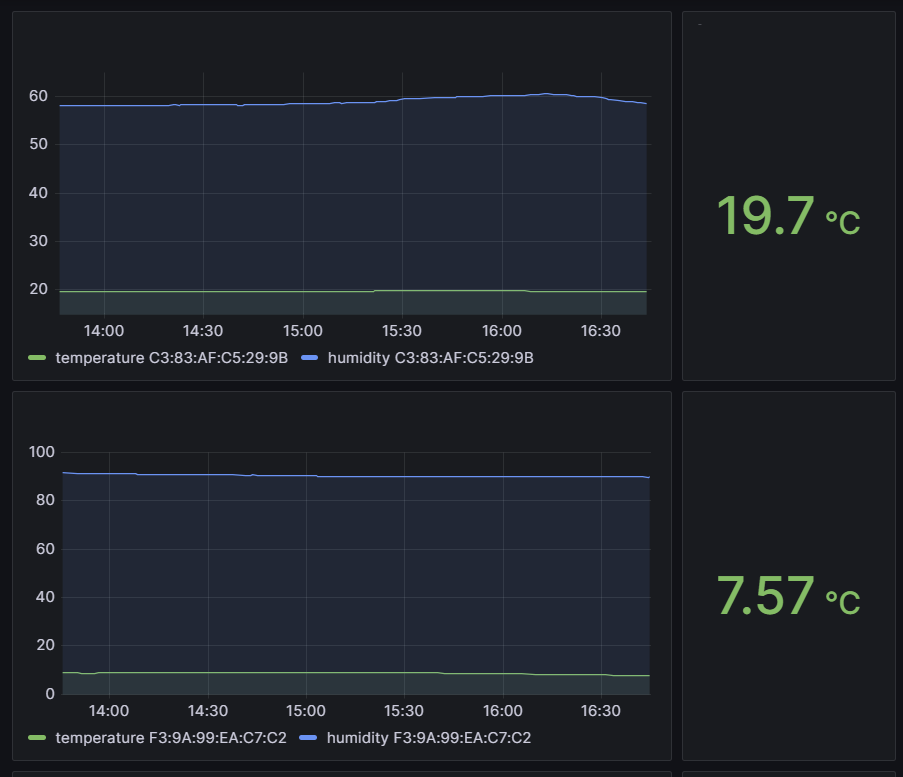
Feel free to mix different visualizations and explore the various possibilities! My dashboard is a dull mix of both demonstrated visulizations.
One last tip
As there are limitations on the InfluxDB Cloud Free Plan (read more about the plans), and because I really don’t need to send the measurement data as a constant data stream, I have set a 30 seconds sleep in method _get_ruuvitag_data inside the file /lib/python3.7/site-packages/ruuvitag_sensor/ruuvi.py. (The last line of the following snippet)
...
@staticmethod
def _get_ruuvitag_data(
    macs: List[str] = [],
    search_duratio_sec: Optional[int] = None,
    run_flag: RunFlag = RunFlag(),
    bt_device: str = "",
) -> Generator[MacAndSensorData, None, None]:

    mac_blacklist = Manager().list()
    start_time = time.time()
    data_iter = ble.get_data(mac_blacklist, bt_device)

    for ble_data in data_iter:
        # Check duration
        if search_duratio_sec and time.time() - start_time > search_duratio_sec:
            data_iter.close()
            break
        # Check running flag
        if not run_flag.running:
            data_iter.close()
            break
        # Check MAC whitelist if advertised MAC available
        if ble_data[0] and macs and not ble_data[0] in macs:
            log.debug("MAC not whitelisted: %s", ble_data[0])
            continue

        data = RuuviTagSensor._parse_data(ble_data, mac_blacklist, macs)
        if data:
            yield data
            time.sleep(30) <---This line here :D
...
Summary
In this blog I demonstrated how to read RuuviTag measurement data over Bluetooth and send it to InfluxDB Cloud, which in turn can be easily connected as a data source to Grafana Cloud for visualizing the measurement data.