Streaming and analysing air quality IoT data with Azure
Looking for a way to stream and analyse IoT data with Azure? Look no further, you’re in the correct place.
In this blog post, I’ll demonstrate how to stream and analyse IoT data with Azure for ten euros or so per month. I’ll start with introducing the architecture and it’s components. As I’m going to stream air quality measurement data, I’m also going to shortly introduce the sensor itself and the particulate matters it measures.
Architecture
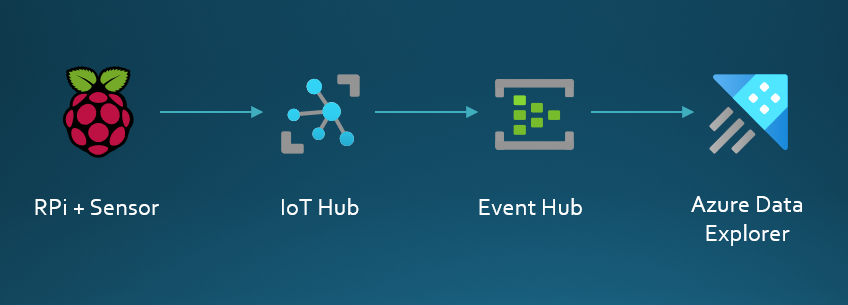
As can be seen from the picture, we are talking about really simple solution. I have an air quality sensor connected to Raspberry Pi. Measurement data from the sensor will be sent to Azure IoT hub. Measurement data received by IoT hub gets routed to Event Hub. And finally we can ingest and analyse the data in Azure Data Explorer.
As I’m using free Azure Data Explorer cluster, I need to use Event Hub in the middle. Paid tiers of ADX-clusters can easily be connected straight to the IoT hub. I’m also using free tier of IoT hub here. I need to use a paid tier of Event hub, but the cost is around ten euros per month, when using Basic SKU.
SDS011 sensor
The SDS011 is a dust and particulate matter (PM) sensor that uses the principle of laser scattering for detecting particles between 0.3 to 10μm in the air. The sensor has been judged to be one of the best low-cost PM sensors, and it can return values of PM2.5 and PM10 through a serial-interface.
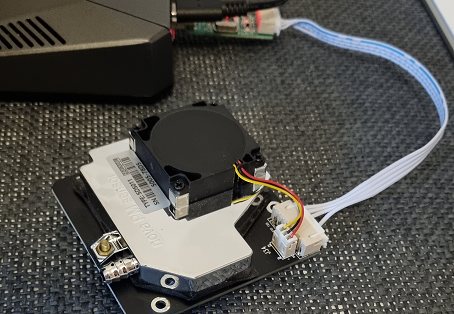
The technology used for the measurement is based on laser diffraction theory where particle density distribution is counted from the light intensity distribution patterns. This is not something I really know anything about, so get more details about this here.
What is Particulate Matter?
Once again I’m in the zone where I’m not an expert. For reference a human hair is typically 70 micrometers, give or take 20 micrometers depending on the individual’s hair.
PM10 is a mixture of particles suspended in the air that do not exceed 10 micrograms in diameter. PM10 air quality has a negative effect on the respiratory system.
PM2.5 are atmospheric aerosols with a maximum diameter of 2.5 micrometers. This type of suspended particulate matter is considered the most dangerous to human health.
WHO has set the standard of the average daily concentration of PM2.5 suspended particulate matter at 25 micrograms per cubic meter. For PM10 limit value is 50 micrograms per cubic meter.
I’m sure you can find more details across the internet, and here’s one link to CDC.
Infra-as-code FTW!
If you have previously visited my site, you have probably already noticed that I like to deploy stuff using infra-as-code. This time is no different. I’ll use bicep-templates for deployment (Github).
## Create resource group and the resources
$ az login
$ az account set --subscription <subscription-id>
$ az group create --name airquality-iot-demo --location westeurope --tags owner=tommi@building4.cloud
$ az deployment group create --name infra-deployment --resource-group airquality-iot-demo --template-file main.bicep --parameters demo.bicepparam
Deployment takes usually about four to five minutes, but I’ve seen longer times as well. While we are waiting, we can check what’s in the templates.
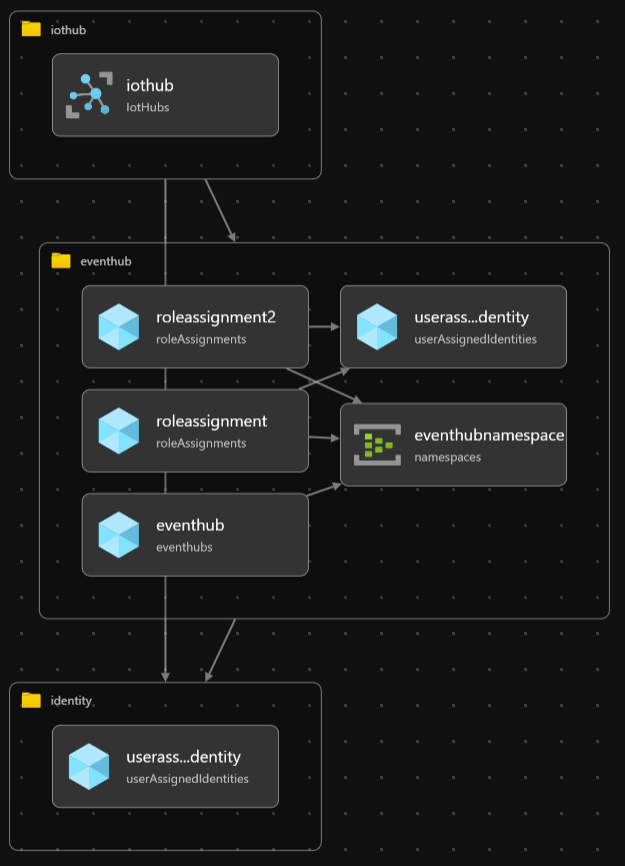
No suprises here, we mainly have one IoT hub and one Event Hub with a namespace. On top of that we have a user assigned managed identity for the IoT hub. As the IoT hub needs permissions over the Event Hub for routing the messages, we need to make some role assignments as well.
Once the deployment is finished, we need to first create an IoT device to the IoT Hub and then retrieve the connection string for sending the measurement data.
## Add iot device and get devicestring
$ az iot hub device-identity create --hub-name airquality-iot-demo --device-id rpi-airq
$ az iot hub device-identity connection-string show --hub-name airquality-iot-demo --device-id rpi-airq --query connectionString
Hopping on to the Raspberry Pi
Being able to send the measurement data, we need some python packages. I like to work with python virtual environments, so that it’s not so easy to mess up everything.
## Create a new virtual environment and work in it
$ mkdir demo
$ python3 -m venv demo
$ source demo/bin/activate
$ pip3 install azure-iot-hub azure-iot-device azure-core pyserial
$ python3 ser_read_airq_measurements.py
Let’s have a look of the ser_read_airq_measurement.py file. Please python-developers no laughing here. I’m not a developer by any means.
#!/usr/bin/env python3
import serial
import json
from azure.iot.device import IoTHubDeviceClient, Message
from datetime import datetime

CONNECTION_STRING = "HostName=airquality-iot-demo.azure-devices.net;DeviceId=rpi-airq;SharedAccessKey=Ew+b3HAc2EI36pwMbv3waYazZ283t76HIAIoTKlDFs0="

def iothub_client_init():
    clientIoT = IoTHubDeviceClient.create_from_connection_string(CONNECTION_STRING)
    return clientIoT

def convert_to_json(pmtwo, pmten):
    json_body = {
            'eventdate': datetime.now().isoformat(),
            'measurement': 'airq_measurements',
            'device_id': 'rpi-airq',
            'measurement_pm25': pmtwo,
            'measurement_pm10': pmten
    }
    return json.dumps(json_body)

def send_to_iothub(payload):
    try:
        message = Message(payload)
        clientIoT.send_message(message)
    except KeyboardInterrupt:
        print ( "IoTHubClient stopped" )

if __name__ == '__main__':
    print ( "Press Ctrl-C to exit" )
    print ( "Initializing" )
    ser = serial.Serial('/dev/ttyUSB0')
    clientIoT = iothub_client_init()

    while True:
        data = []
        for index in range(0,10):
            datum = ser.read()
            data.append(datum)
        pmtwo = int.from_bytes(b''.join(data[2:4]), byteorder='little') / 10
        pmten = int.from_bytes(b''.join(data[4:6]), byteorder='little') / 10
        formatted_data = convert_to_json(pmtwo, pmten)
        print ( formatted_data )
        send_to_iothub(formatted_data)
In short, the script is reading the measurement data by initializing the serial connection and the connection to IoT Hub. Once measurement data id recieved through serial, it’s converted to json, that’s suitable for a IoT hub. The script also prints out the formatted data to the console. As my sensor is currently set to make the measurement every one minute, the output looks like the following.
...
{"eventdate": "2023-10-14T13:46:55.590598", "measurement": "airq_measurements", "device_id": "rpi-airq", "measurement_pm25": 1.7, "measurement_pm10": 3.9}
{"eventdate": "2023-10-14T13:47:55.702321", "measurement": "airq_measurements", "device_id": "rpi-airq", "measurement_pm25": 1.0, "measurement_pm10": 1.9}
{"eventdate": "2023-10-14T13:48:55.810973", "measurement": "airq_measurements", "device_id": "rpi-airq", "measurement_pm25": 1.6, "measurement_pm10": 4.9}
{"eventdate": "2023-10-14T13:49:55.923208", "measurement": "airq_measurements", "device_id": "rpi-airq", "measurement_pm25": 1.5, "measurement_pm10": 3.3}
{"eventdate": "2023-10-14T13:50:56.033323", "measurement": "airq_measurements", "device_id": "rpi-airq", "measurement_pm25": 1.4, "measurement_pm10": 6.5}
{"eventdate": "2023-10-14T13:51:56.144776", "measurement": "airq_measurements", "device_id": "rpi-airq", "measurement_pm25": 1.5, "measurement_pm10": 3.9}
{"eventdate": "2023-10-14T13:52:56.260449", "measurement": "airq_measurements", "device_id": "rpi-airq", "measurement_pm25": 1.2, "measurement_pm10": 2.9}
...
On to the Azure Data Explorer
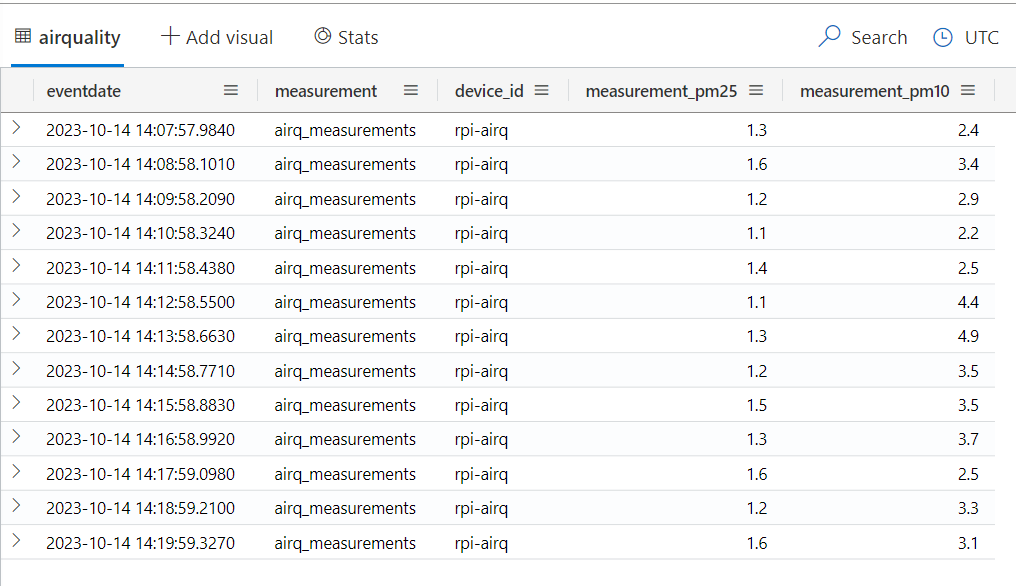
Note that I have already created an database called measurementdata and configured data ingestion to a table called airquality using Event Hub as the source. Microsoft has a good documentation how to do this. I’m using JSON as data format for the schema.
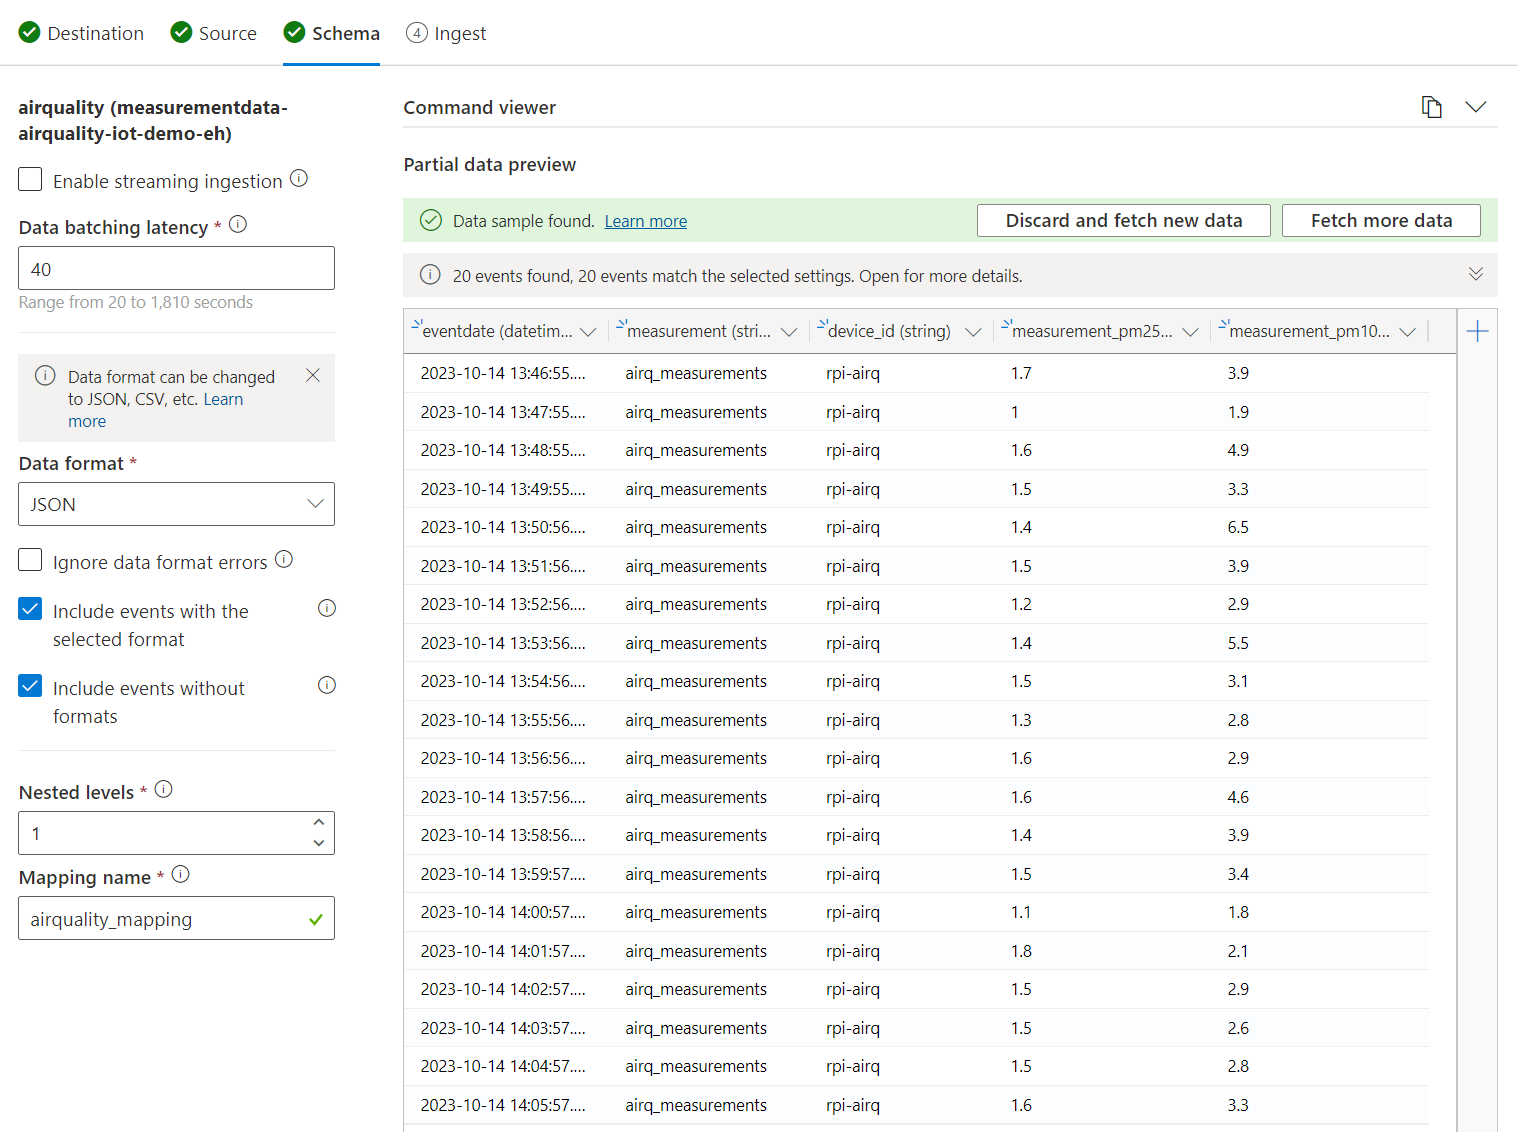
Now if we then check the contents of airquality table, we can see that data gets ingested there.
As it is a bit boring to look at a table, let’s quickly do a dashboard by clicking the Dashboard on the left-side menu and adding a New dashboard with a name Air quality measurement data.
We need to add tile and create Data source for it. Cluster address is needed in this step.
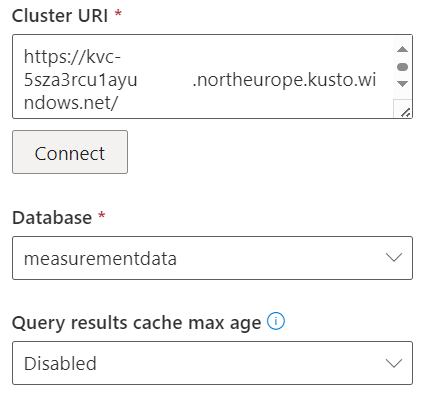
Once the data connection has been created we can create a simple kql query to be used for the dashboard.
airquality
| where eventdate > _startTime
After saving the changes, we end up seeing similar view of the data in the table as previously. Let’s finally change it to be bit more visual. By first clicking the pencil-icon, we can change the Visual type to for example a Line chart, and maybe even giving the tile a more meaningful name like Home office air quality.
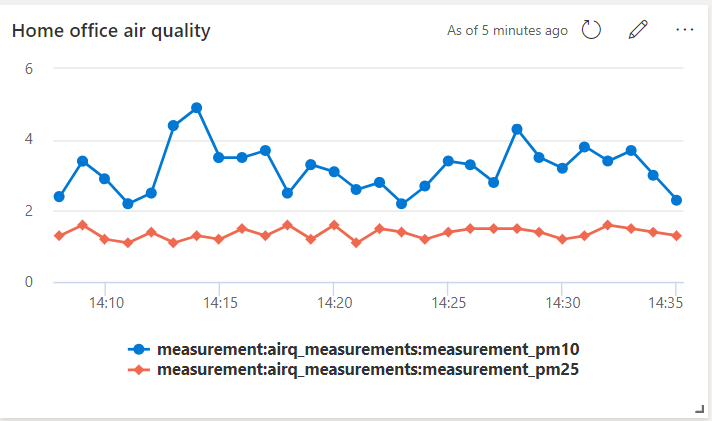
We can see that the measurement values are reasonable low, and that’s a good thing.
What did we learn today?
In this post I demonstrated how to stream and analyse iot data with Azure. Particularly I used a SDS011 dust and particulate matter sensor connected to a Raspberry Pi for measuring the amount of PM2.5 and PM10 in the air. This measurement data was first sent to IoT hub, then automatically routed to Event Hub, and finally ingested and analysed the data by visulizing it in Azure Data Explorer. Monthly cost? Around ten euros as there are so many free tiers and services on Azure!
Feel free to reach out to me on LinkedIn if you have any questions or comments.
Over and out.